🗓️ Live Webinar November 9: How HealthMatch.io Used Customer.io and RudderStack to Launch Their New Business Model in 24 Hours
Blog
PRODUCT
Distributing Alert Messages From Grafana With Webhooks


Subscribe
We'll send you updates from the blog and monthly release notes.

Benji Walvoord
October 12, 2021
RudderStack allows you to easily connect your applications, data warehouses and cloud storage devices to enable the processing of billions of events per day. To support the oversight of our pro and enterprise clients, we offer an intelligent dashboard powered by Grafana. You can check out a recent post on using Grafana to Monitor the Health and Status of your customer data pipelines to learn more about the specifics of the more than 275+ different metrics we track, but what do you do when there is an issue that needs attention?
In this post, we’ll highlight how easy it is to create an alert within Grafana and send that to a RudderStack Webhook Source which can then deliver the alert notice to downstream tools like Slack, Microsoft Teams, Email and tools like PagerDuty and Data Dog. Yes, most of these downstream tools can be wired directly from Grafana, and the setup is similar, but if you have other tools that are not available, want to record these events in your warehouse, or have some tool that does not natively alert 3rd party tools, passing them through RudderStack is a nice option.
To keep things simple, let’s say we have two different alerts that we want to monitor and need to distribute to different teams, one of which is outside of the organization.
The first are failed messages going into Salesforce. Salesforce is a critical system for the sales team, so we set a zero tolerance and create an alert that will notify all internal parties via email and slack should our threshold of one failed event per hour be crossed.
The second alert will be to the contractors working on our new marketing website. We expect some hiccups during testing, but we still want to monitor failed page calls and forward these to the Microsoft Teams channel we’ve set up with a medium severity.
Here’s how we’ll set up these alerts.
Step 1: Create your webhook source & destinations
Before we can set up the alerts and notification channel in Grafana, it will help if we create our webhook source in RudderStack first as we will need to copy and paste the address for the newly created source into the Grafana Notification Channel we create in the next step. Check out the RudderStack Documentation for specifics, but it’s as simple as creating a new source in RudderStack and selecting the Webhook option under Event Streams.
After you give it a name, you can find the specific URL for your webhook on the settings tab:
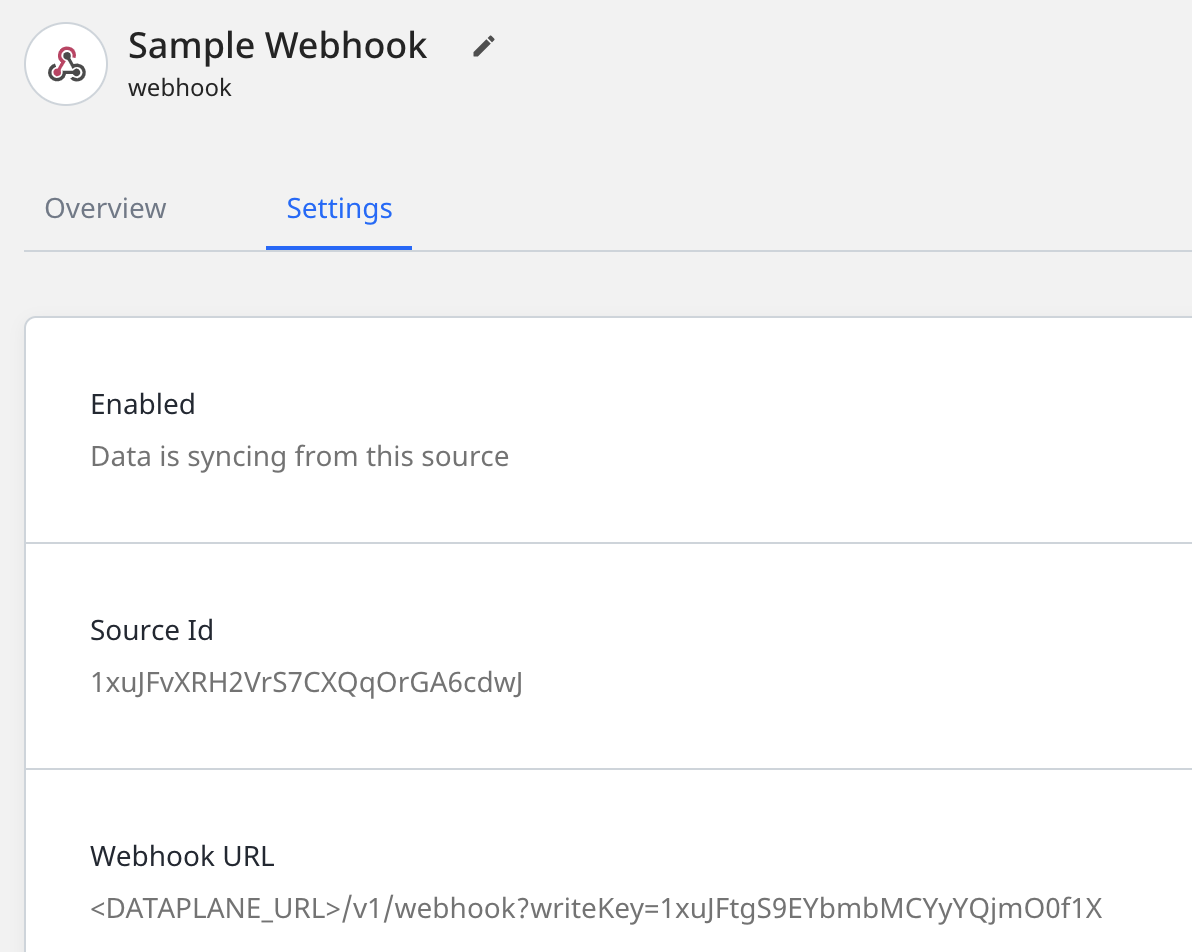
The Dataplane URL can be found on the top of your main Connections page. Once you have the URL for your webhook, record it - you will need to add this in the Basin setup in the next few steps.
When connecting downstream destinations for your webhook, it’s important to consider the types of payloads you will be receiving from your various sources. As we mentioned, Webhooks have no filters and the data you receive may not be in the right format prior to being forwarded to your destinations. User Transformations are a great tool for filtering unnecessary events and modifying payloads into the correct format for each specific destination.
Step 2: Create a notification channel in Grafana
This example will assume you already have access to your Grafana dashboard. If you need assistance setting up your dashboard or configuring your panels, please contact our customer success team and watch our Technical Session on setting up Grafana dashboards and alerts.
Open the notifications window on the left side of your dashboard (the alarm icon) and select Notification channels.
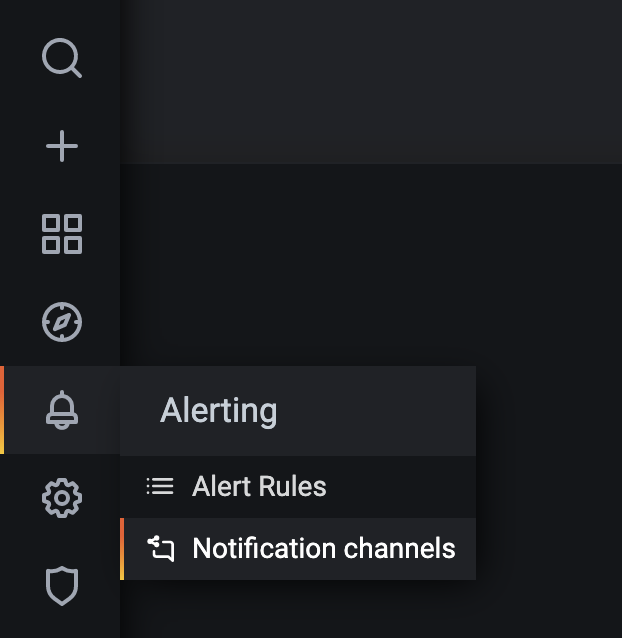
Click the New channel button and give this a name. For our example, we called this “RudderStack Webhook” and selected “webhook” from the Type dropdown. Next, enter the address for our RudderStack Webhook source from the previous step. There are no additional settings we need to make for the webhook.
Note: As mentioned above, you can also select a native integration for tools like Slack and PagerDuty here as well and when setting up alerts notifications, you can send the alerts through multiple channels at the same time.
Step 3: Defining our alerts
For our project, we want to create two different alerts and will send both to the same RudderStack webhook. You might be tempted to create two different webhooks based on the severity or audiences of the alerts, but we can manage this with user transformations within RudderStack.
To create an alert, select a panel to edit on your dashboard or create a new one. We will create a new panel called “Failed Processor Errors” to alert us of when events are failing while being sent to their downstream destinations.
To do this, we create a query using the Influx DB (Influx is the database RudderStack uses to store your event counts, not your events themselves) and select the metric “proc_error_counts”. In the WHERE clause, we select our production instance.
Next, select the “sum()” option (we want a total number of failures) and we’ll group by 1 minute intervals as we want to know very quickly if something is failing. If we were just monitoring event volumes, a more appropriate time grouping might be every 30 minutes, hour, or even day but given the sensitivity of this alert, 1 minute is appropriate.
We will group by the “destName” so we can see exactly which destinations are causing errors. We will also add a “stage” grouping to indicate whether our errors are occurring within the User Transformation or the Destination Transformer. This will be helpful in ultimately troubleshooting the error.
So our query looks like this:
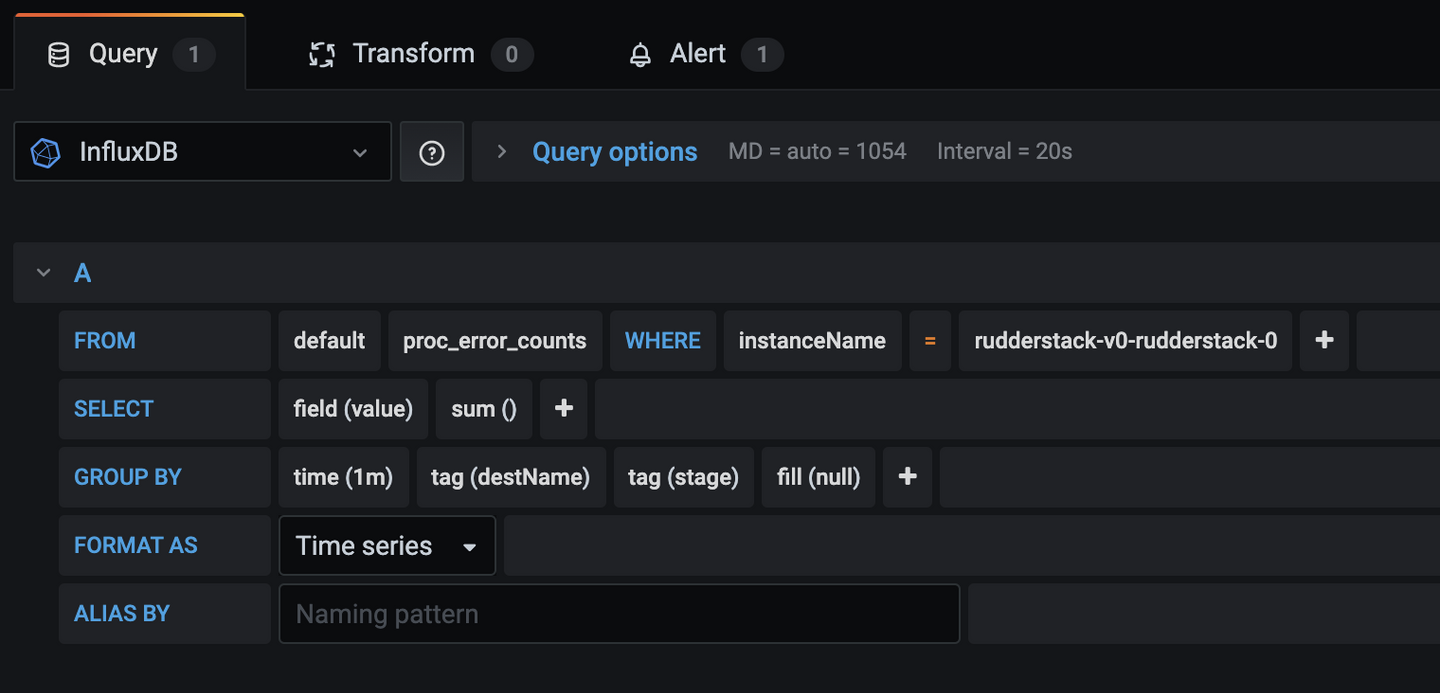
With the query created, we will begin to see charting on our panel, but, more importantly, we can set up our Alert. To do this, click the Alert tab next to the Query tab in the same window.
Alerts are created for a specific query and are defined by thresholds being met over a certain period of time. For our example where we want to know of any error message, we will set our threshold greater than 1 (meaning 1 or more error from proc_error_counts per minute) within the last minute.
We can add a message here as well as different tags, both of which are passed within the JSON payload. Once you click Save and Apply, messages will start flowing once a single event fails. The dashboard panel will display a vertical dotted red line if you are using a standard graph chart to indicate an alert has been issued.
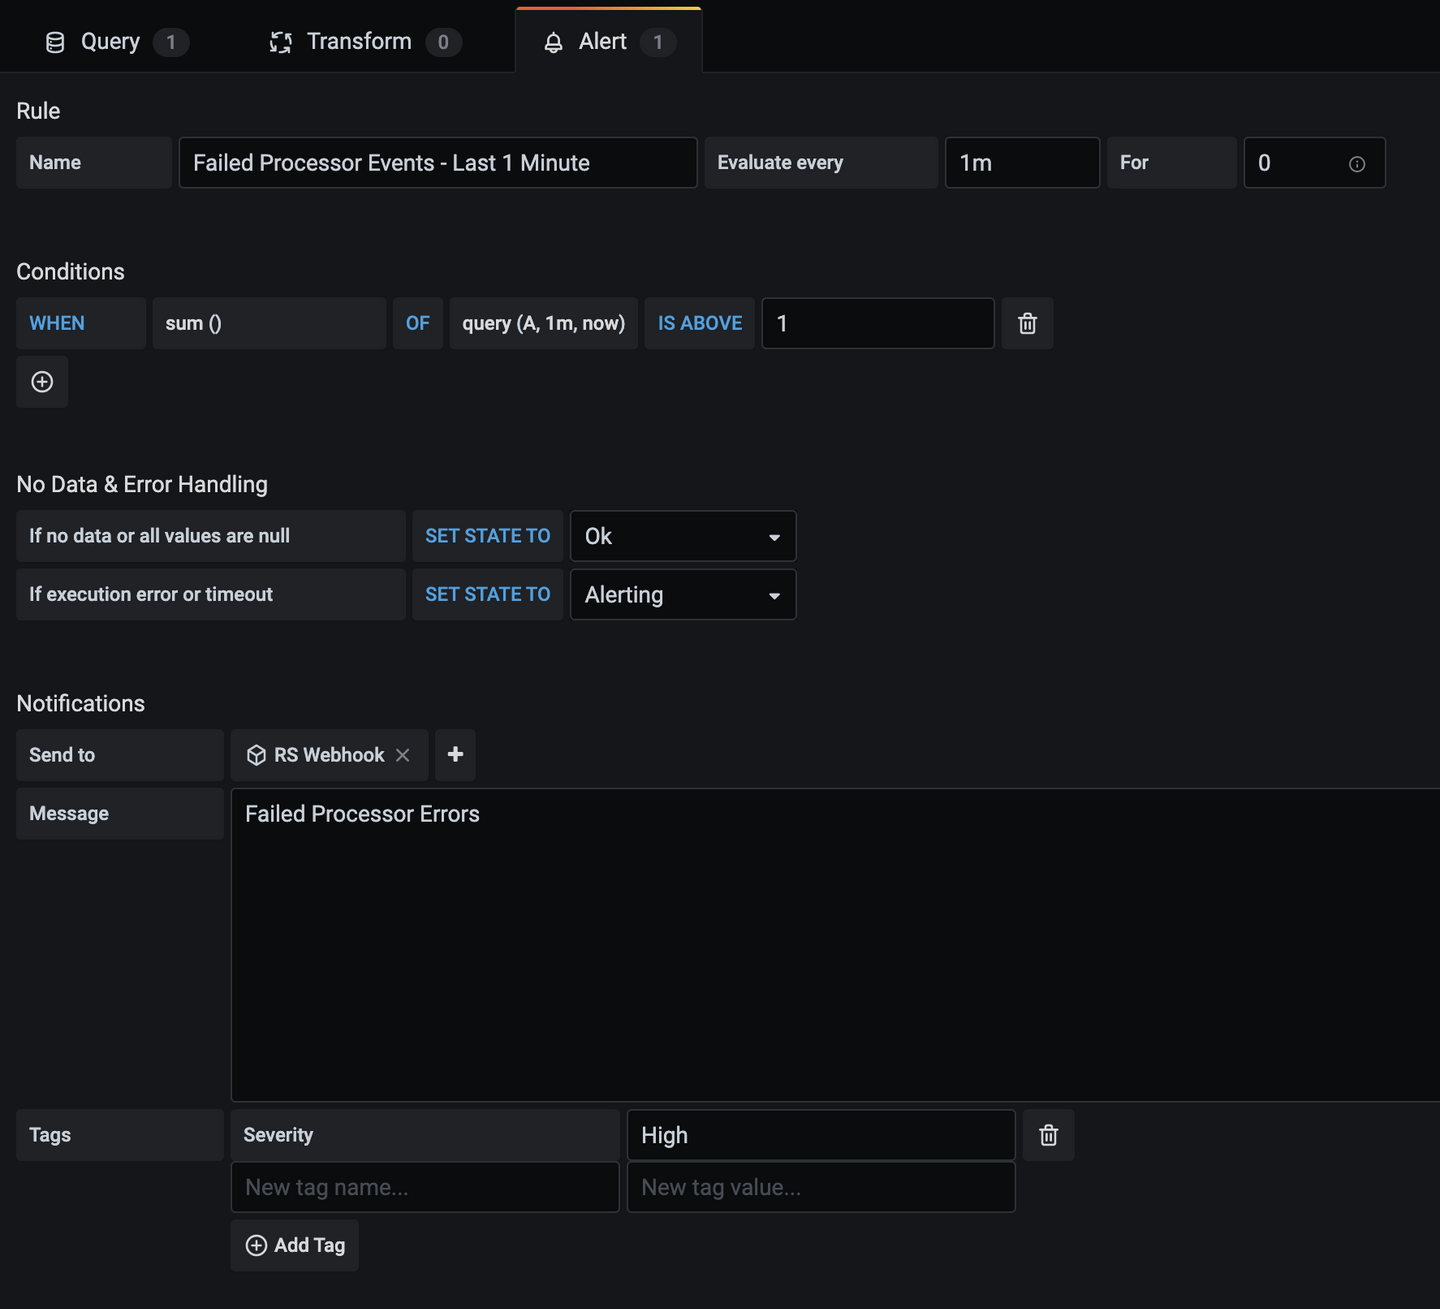
Note: This is a very strict window and not applicable to most scenarios. Grafana Alerts are highly configurable and we encourage you to peruse the documentation before you get too far down the road.
Step 4: Viewing the incoming payloads
Within the RudderStack Webhook source Live Event Viewer we can now see alert messages flowing.
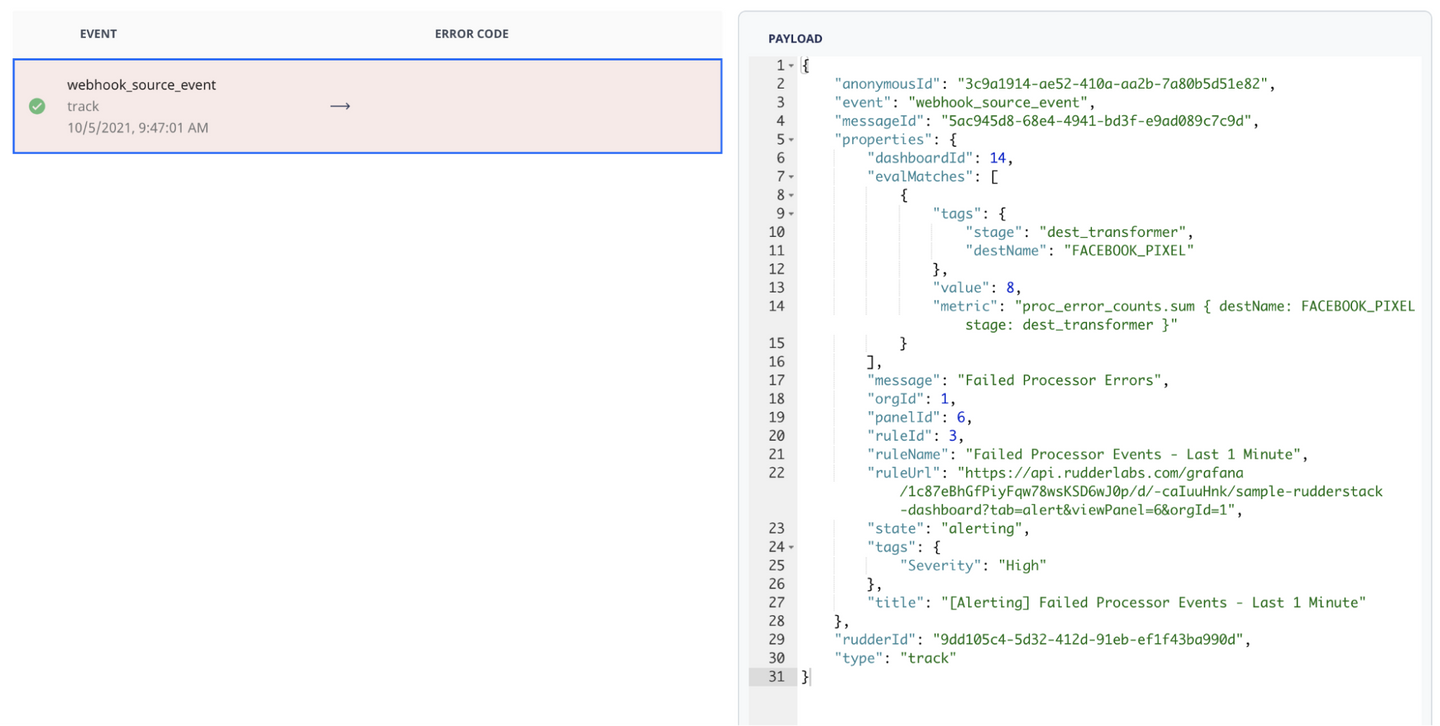
If we take a look at the payload, we can see a few details about our event, namely the evalMatches property which tells us this alert came from our Facebook Pixel destination and the error occurred in the destination transformer and not the user transformation. The error also returned a value of 8 which means there were 8 errors during our reporting period of 1 minute.
JAVASCRIPT
Step 5: Connecting downstream tools in RudderStack
With alert events now able to flow into our RudderStack Webhook source, we need to create destinations and user transformations based on the different alert notices. As we mentioned above, website and marketing notices will go to our web and social teams via a shared Microsoft Teams channel while Salesforce errors will go to our internal Slack team. We will create user transformations to filter out messages we don’t want to go to various parties. Take a look at the example below and then reference the various destination sections below.
For our Facebook destination, we will apply a user transformation that filters for Facebook Pixel events like the following:
TEXT
Sending events to Microsoft Teams channels
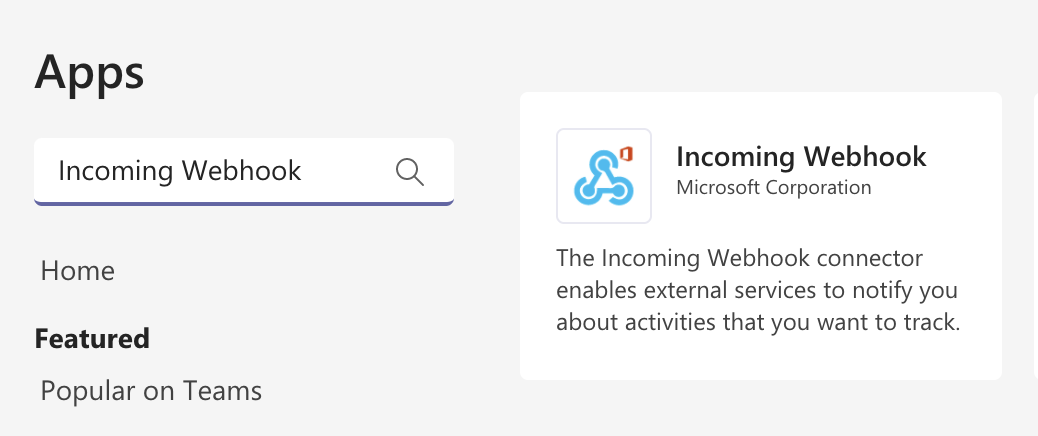
To send events to Microsoft Teams, you first need to create an Incoming Webhook Connector to your teams channel. For our example, we will pass a plain message, but you can check out the MS Connector Cards Docs on how to customize the user transformation to support the full feature set of MS Active Cards. Within the Teams application, click the Apps icon in the lower-left corner and type Incoming Webhook in the search bar. Click on the Incoming Webhook to create a new one.
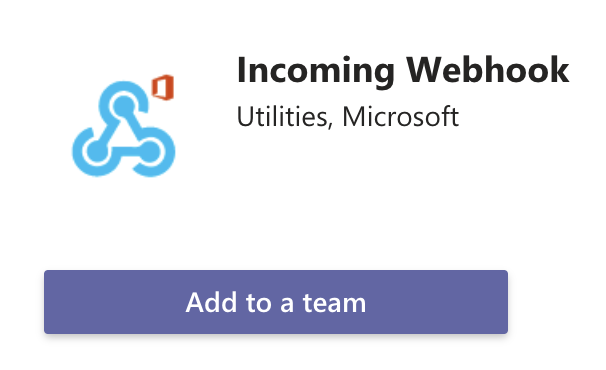
Add it to a Team and then select the Notifications/Alert channel for your use case.
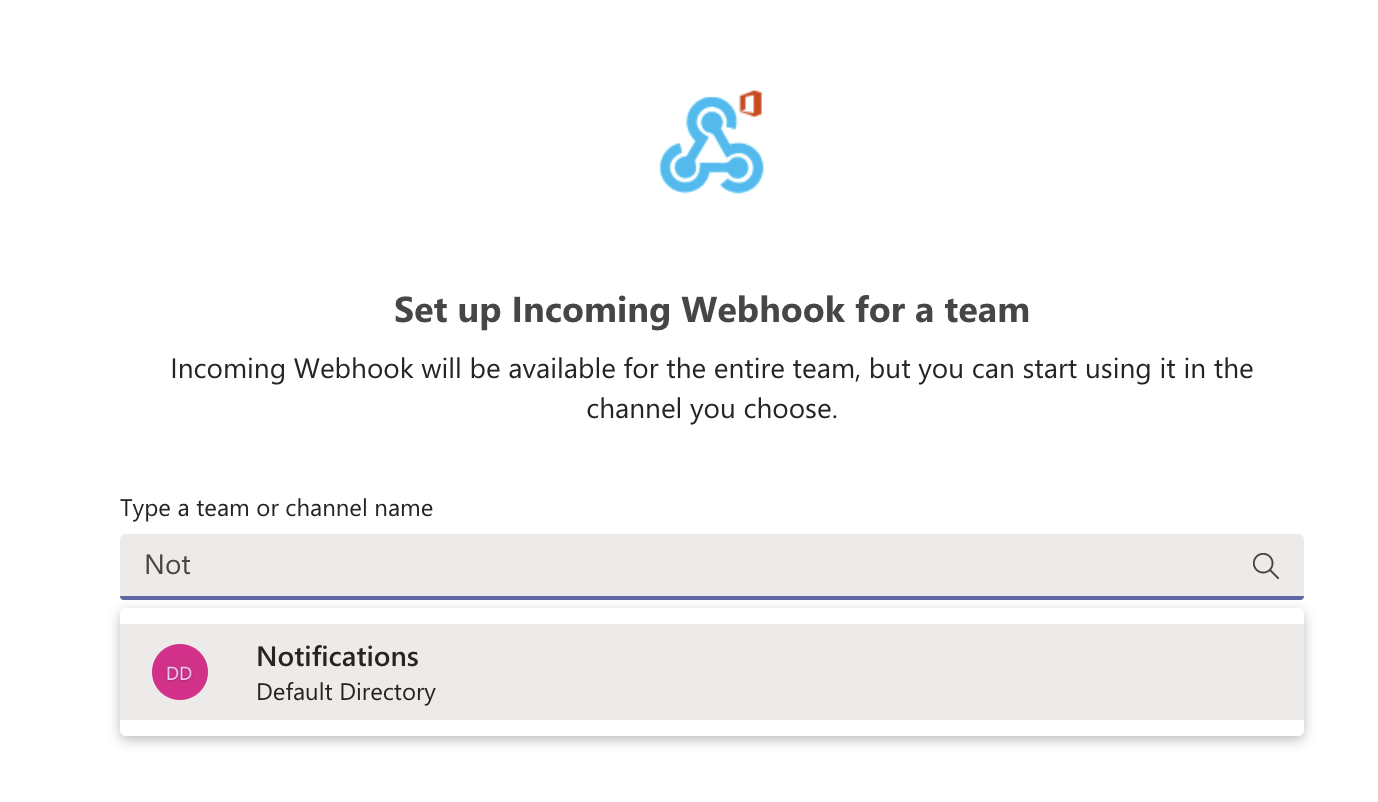
For our example, we selected a new Notifications channel we created for the demo:
Name it and give it a logo if you want. We chose RudderStack but you might choose the inbound alert system and/or a scarier warning
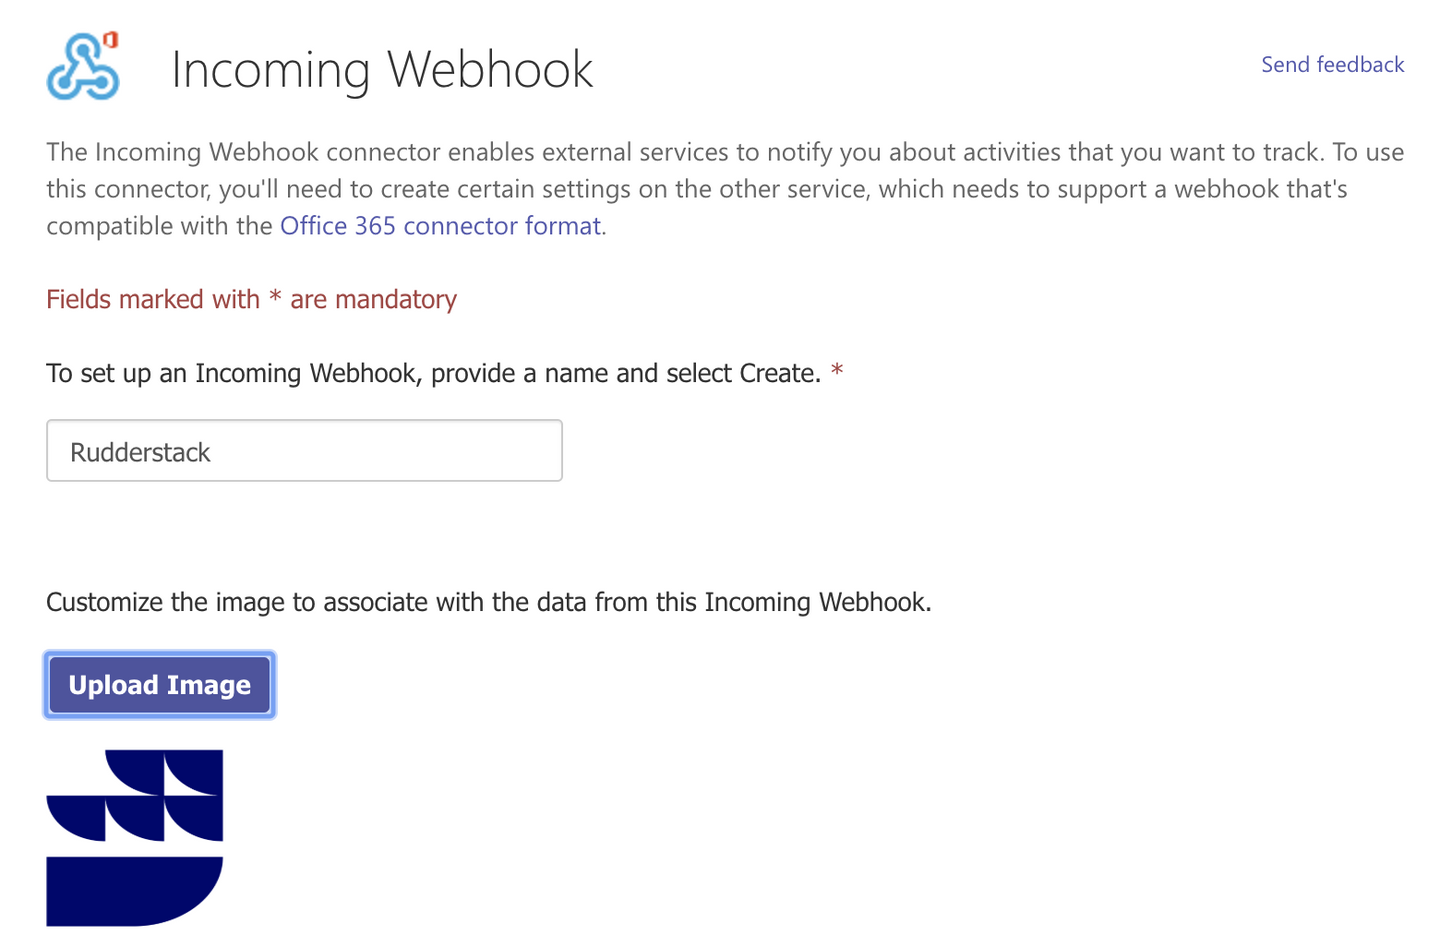
All that remains is to create the destination in RudderStack for our MS Teams Webhook.
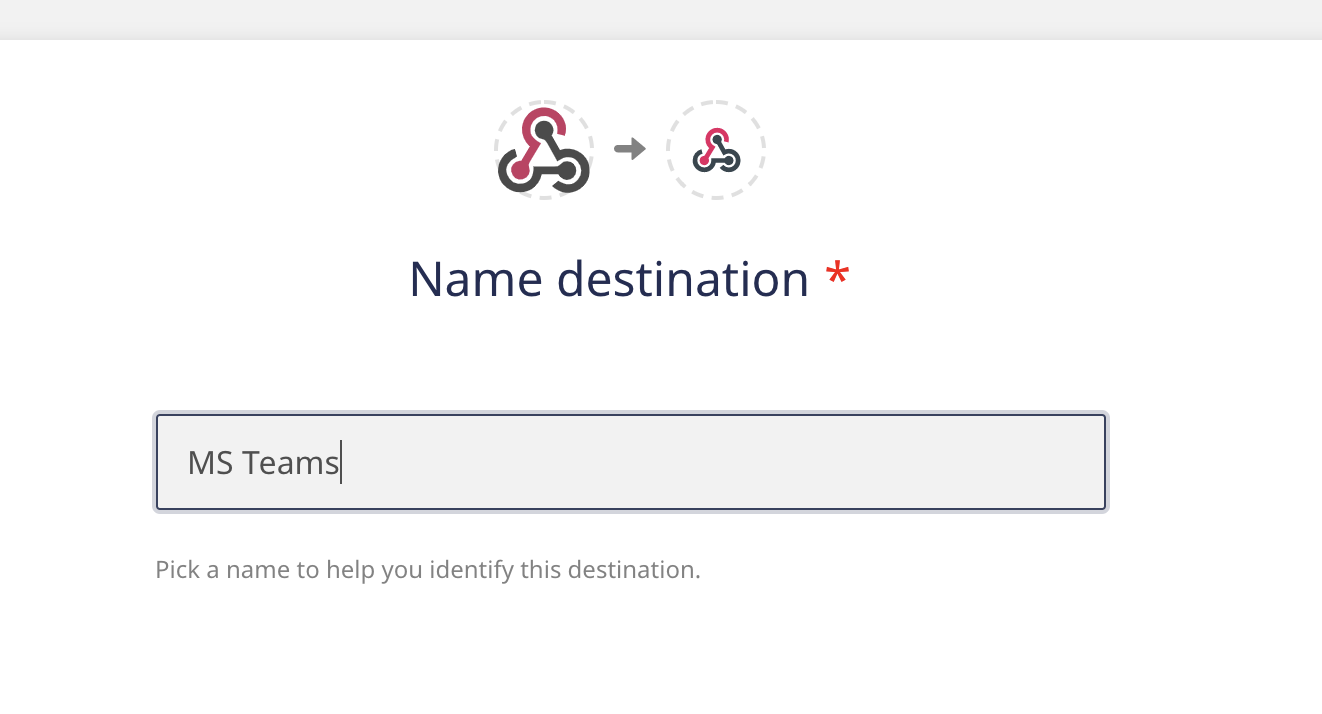
To do this, Paste the URL from our MS Webhook into the destination.
If you take a closer look at the User Transformation we created above to filter for only Facebook_Pixel alerts, you will also see that we added a new Text attribute in the payload. The Text attribute is the only value required for our webhook and is what is rendered in the message itself.
Here is an example of the alert we created in the MS Teams channel.

Sending events to Slack
Since Slack has a native integration with RudderStack, forwarding alerts to Slack channels can be accomplished in a few simple steps. Similar to our MS Teams example above, you will most likely want to create a user transformation to filter some of the messages and/or prepare the payload text for better formatting in Slack.
For more detailed instructions on setting up Slack as a RudderStack Destination, please check out our Slack Documentation.
Sending events to PagerDuty
There are a number of ways to send event data to PagerDuty from both Grafana as well as the RudderStack application itself (see RudderStack Alerting Guide), but if you have the need to send custom alert messages to PagerDuty, you can accomplish this through the use of their Send Events API.
Similar to the MS Teams example, you will want to create a new Webhook Service in PagerDuty and then use that address when creating a new RudderStack Webhook destination. You will also need to create a user transformation on the destination to both filter the events and format the payload to match the requirements for PagerDuty.
Reference the Schema documentation from PagerDuty for more specifics on exactly how to configure your payload in the user transformation.
Start by creating a new service from the services menu within PagerDuty. Provide a name and description, select an escalation schedule and alerting group. Under the Integrations option, select “Passthrough Webhooks for Development” to create a generic webhook.
You will be prompted to record the Integration Key and provide an Integration URL. Copy the URL for your RudderStack Webhook Destination.
https://events.pagerduty.com/integration/YOUR_INETGRATION_KEY/enqueue
Here is an example of a message based on the Facebook Pixel alert from the previous example:
JSON
And here is what the event looks like in PagerDuty’s UI:

Other Webhook use cases
Distributing alert messages is just one of many uses for RudderStack’s Webhook source. We’ve also written guides on overcoming the limitations of client-side form tracking and streaming events from salesforce for lead enrichment. We’d love to hear from you about the different ways you’re leveraging the integration. Join us on Slack to let us know.

ABOUT THE AUTHOR
Benji Walvoord
Recent Posts

Subscribe
We'll send you updates from the blog and monthly release notes.

Get started today
Start building smarter customer data pipelines today with RudderStack. Our solutions engineering team is here to help.
This site uses cookies to improve your experience. If you want to learn more about cookies and why we use them, visit our cookie policy. We’ll assume you’re ok with this, but you can opt-out if you wish Cookie Settings.
