🗓️ Live Webinar November 9: How HealthMatch.io Used Customer.io and RudderStack to Launch Their New Business Model in 24 Hours
Blog
ENGINEERING
How To Avoid Response Time Alerts Triggered by Slow Clients


Subscribe
We'll send you updates from the blog and monthly release notes.

Leonidas Vrachnis
Tech Lead at RudderStack
August 10, 2022
Request monitoring
At RudderStack our core streaming product receives HTTP requests from a vast and diverse client base. We have many SDKs, enabling different devices to send events through RudderStack from users all over the world, via all kinds of networks.
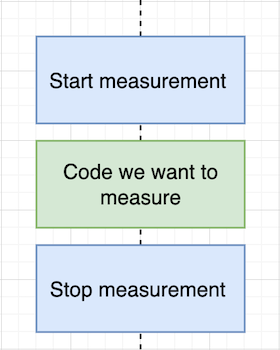
Our engineering team closely monitors the response latencies to ensure our SLAs are met and to discover anomalies within our system and clients. To measure the request latency in our Go code we use a middleware in our router. We observe the 95 and 99 percentile of response times using statsd and InfuxDB to collect and store them. Furthermore, we have set up alerts using Kapacitor to notify us when those latencies are high. You can see how the request latency measurements work in the diagram below, notice that we specify the code we want to measure.
Note: We now are migrating from InfluxDB to Prometheus, but this is a story for another post.
For the most part, these request latency alerts have been useful for us. They’ve helped us detect database issues, such as slow reads and rights, but in one instance we began getting a high volume of alerts for an issue that was outside of our control.
Noisy latency alerts
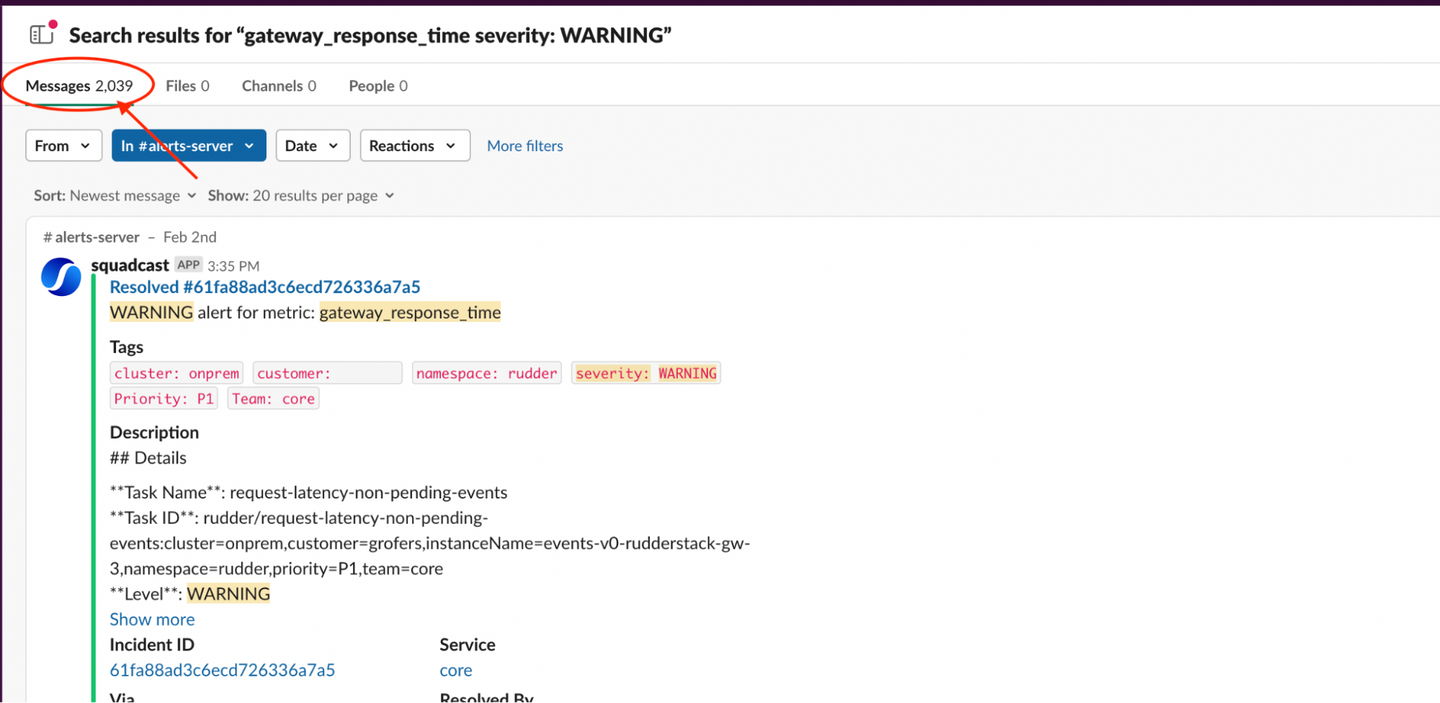
As the RudderStack customer base grew and became more geographically diverse, we started getting high response latency alerts for a small subset of customers. This meant our on call engineers were burning time checking the related graphs for 5-6 alerts per day.
While the graphs did show spikes for response latencies, there was no other metric indicating a problem on our end. Everything seemed normal. Nobody likes wasting time, and alerts aren’t useful if they’re not actionable, so we knew we had some work to do.
First, we needed to perform a deeper analysis to confirm that the alerts were indeed noise. Then, we had a decision to make: either fix the problem or remove the alerts. To determine the right course of action, we needed to investigate the issue further.
Investigating the noisy alerts
To investigate the issue, we added additional metrics to every part of the HTTP request. This allowed us to isolate the problematic section in the code and expose the issue. We found it was the time taken to read the request body that was causing the latency and triggering alerts.
Because these HTTP requests were large, they were broken down into multiple TCP packages. In this case, the head was making it through, triggering the latency measurement for our alerts, but the packages in the body were getting delayed or retransmitted, resulting in abnormally long processing times.
This observation indicated that the latency was due to a network issue and not a RudderStack issue! While this came as a relief to our team, we needed to dig deeper to get a better understanding of what was going on. To confirm our hypothesis, we had two options:
- Use a tool that captures all traffic at the lowest possible level - We tried to use tcpdump and wireshark to analyze the network traffic, filter the slow HTTP request, and examine their TCP packages. Ultimately this approach wasn’t practical. The issues weren’t frequent enough and could happen to different customer installations, so it just didn’t make sense to capture all those networks for a such long period of time.
- Replicate the problem - We always try to replicate the problem in a more controlled environment. First, we started working on an HTTP server that was able to emulate the effects of a slow network, but it turns out this was not necessary since curl has an option. Using
curl --limit-rate 1kwe replicated the problem and set out to find a solution.
Replicating the problem confirmed our hypothesis – the latency alerts were caused by network issues that were out of our control. We did not cause and could not fix the issue, so the alerts were not actionable for our team. They were noise, and we needed to find a way to remove them.
But weren’t these alerts useful at one point?
Before we move on, it’s worth discussing how these alerts got noisy. As mentioned above, we set up the alerts for a reason. Initially they were actionable alerts that provided value and did help us detect database issues. So, what went wrong?
The problem was introduced by the expansion of our user base. As our global footprint grew, we began receiving legitimate traffic from bad networks. After all, not every place in the world has fiber optics and 5g. These slow clients created the issue with the long body read times, compromising the alerts.
Issues stemming from slow clients are well-known. Often they raise security concerns because untrustworthy clients could overload the system by sending crafted slow requests leading to a DDoS. In our case, the pattern of the traffic didn’t indicate a security issue because it was so small. Our problem was limited to the noisy alerts. Here’s how we solved it.
Removing the monitoring noise
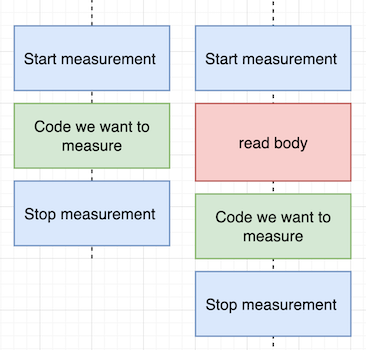
To fix the issue with our noisy alerts, we needed to ensure measurement would only happen after the whole body was transferred from the client. The diagram below highlights how the read body step interfered with our measurements:
We looked at three different ways to do this before settling on a solution:
- Avoid monitoring middleware altogether
- Use body buffering middleware
- Use a proxy with body buffering
Avoid monitoring middleware altogether
We use monitoring middleware to eloquently add cross-cutting concerns like logging, handling authentication, or gzip compression without many code contact points. In this case, a middleware intercepts HTTP requests and runs before and after any of the specific request-handling code runs. It’s a convenient way to add monitoring in a single place that works for all your HTTP handlers. In Go, the HTTP middleware captures the time it takes to read a body by default (problematic for us in this scenario 😬). You can see an example of this here.
So, one option we considered was to rip out middleware altogether. This would allow us to go in the code and specify exactly the code section we want to measure in every HTTP handler, meaning we could remove the read body step from our measurement. The difference in measuring after read body takes place vs. before is shown below:
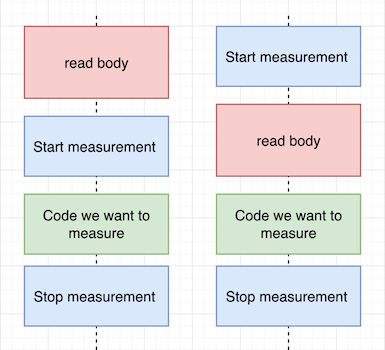
The problem is, ripping out the middleware because of this one issue would require us to write a bunch of code to replace the rest of its functionality. We’d be throwing the baby out with the bathwater and creating a lot of extra work for the team in the process. We wanted to avoid the unnecessary complexity this would have added, so we decided not to go with this solution.
Body buffering middleware or fight middleware with middleware
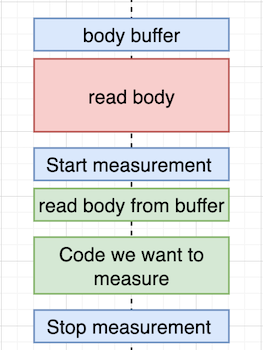
Another option we explored was using more middleware to read the whole HTTP body in memory before the middleware that’s responsible for measuring processing time runs. Let’s call this body buffer middleware.
In our scenario, as long as the body buffer middleware runs before the measurement middleware, slow clients won’t affect our metrics and no faulty alerts will trigger.
Let’s take a look at this body buffer middleware. Here’s how middleware can be implemented in Go:
GO
Here’s how this works. In the default Go HTTP library, the body is just an interface.
GO
This means we can easily override it with anything that implements the Read and Close method. In this case, we use io.NopCloser to help satisfy the io.ReadCloser interface, by implementing both the Read and Close methods for the buffer.
In the body buffer middleware we read the body from the HTTP request and keep it in a memory buffer. Our in memory buffer can be injected back to the HTTP request struct. Now the HTTP handler will read from the memory buffer as if it were the original body. This time, because it’s reading directly from memory and not from the network, it happens instantly. Problem solved! With instant body reads from memory, the measurements later in the code aren’t affected by clients with slow networks. Check out our Github repo to run the code yourself to see how this works.
Note: Ideally we would pair this implementation with http.MaxBodyBuffer, especially in case our Go service is directly exposed to the internet, because MaxBytesReader will limit the number of bytes we can buffer per request.
This solution solved our problem nicely, but ultimately we chose a different option. However, we don’t see exploring and developing this solution as wasted effort. In all likelihood, we’ll use it in the future for standalone problems. We’ve also considered using this solution for our open source offering and may implement it in the future.
So why didn’t we go with this solution? Well, it comes down to our different product tiers (Pro vs. Enterprise) and our existing use of Nginx. I’ll explain below.
A proxy with body buffering
The first option we considered, and the one we ultimately settled on, was to use a proxy. In this case, the proxy serves as a buffer for slow clients. It waits for the body to be read and will not send the full HTTP request to our service until body parsing is complete. Because this happens on an internal network, the time of communication between the proxy and our service should happen essentially instantaneously and not to exceed our alerting thresholds.
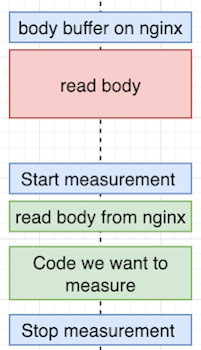
For our Enterprise tier, we use Nginx as a web server for the RudderStack web app. We also use it as a reverse proxy to distribute requests. Nginx uses body buffering on incoming requests by default, meaning it won’t forward the request to an upstream server unless the whole body is read.
In our investigation of the noisy alert issue, we noticed the problem was isolated to customers on our Pro tier. At the time, Enterprise customers had Nginx, but we were using AWS Application Load Balancer for our Pro customers. We were getting the noisy alerts for Pro customers because the Application Load Balancer doesn’t support body buffering.
After exploring a few alternate solutions, our team determined that using a proxy with body buffering was the best solution because we already used Nginx, with its body buffering by default, for Enterprise. Implementing Nginx for Pro was a relatively low lift for our team, and it actually reduced our maintenance overhead because it made our Enterprise and Pro environments more similar.
Conclusion
When our team began getting a high volume of latency alerts, we were concerned. But by investigating the issue, we were able to diagnose the problem (luckily it wasn’t a RudderStack issue). After exploring a few potential solutions we settled on leveraging Nginx and its default body buffering to remove the monitoring noise from our alerts. We also built a useful solution on our own in Go. While we didn’t end up using it for this particular issue, we’ll likely leverage it to solve other problems in the future.
Now that we have implemented the fix, our team no longer has to deal with the noisy alerts, freeing up time for more important work. If you love solving problems like this one, come join our team! Check out our open positions here.

ABOUT THE AUTHOR
Leonidas Vrachnis
Tech Lead at RudderStack
Recent Posts

Subscribe
We'll send you updates from the blog and monthly release notes.

Get started today
Start building smarter customer data pipelines today with RudderStack. Our solutions engineering team is here to help.
This site uses cookies to improve your experience. If you want to learn more about cookies and why we use them, visit our cookie policy. We’ll assume you’re ok with this, but you can opt-out if you wish Cookie Settings.
