🗓️ Live Webinar November 9: How HealthMatch.io Used Customer.io and RudderStack to Launch Their New Business Model in 24 Hours
Blog
PRODUCT
Why You Should Care About Dimensional Data Modeling


Subscribe
We'll send you updates from the blog and monthly release notes.

Brian Lu
Director of Product
October 25, 2022
It’s easy to overlook all of the magic that happens inside the data warehouse. At RudderStack, our conversations tend to focus on the challenges of getting data into the warehouse and on all of the products we build on top of our warehouse data. When we create architectural diagrams for RudderStack, we tend to represent the warehouse with a single icon. But this doesn’t do justice to all of the work that happens inside of the data warehouse.
In this post we’ll dive into dimensional data modeling to get a better appreciation of all the activity going on beneath the surface. We’ll also look at how dimensional data modeling shows up within the RudderStack application.
What is dimensional data modeling?
Dimensional data modeling is a way to structure data in a warehouse that mitigates the loss of data granularity and allows people to do data work in a performant way. It’s structured around two major principles:
- THINGS THAT ARE are called Dimension Tables (e.g name, address, email, subscription status). These things may change slowly, but they mostly stay the same.
- THINGS THAT HAPPENED are called Fact Tables (e.g. clicks, purchases, etc.). This data is immutable (once it happened it happened!) but the tables can get very big as product usage increases.
There can be cross-pollination between Dimension Tables and Fact Tables. For example, updating your address is an action that happens (fact) and changes the value for your profile (dimension). This is okay because dimension tables are efficient in aggregating or filtering data. This enables us to answer questions like “how many subscribers live in Chicago?” without having to duplicate the data everywhere.
Getting data faster with denormalized tables and cubes
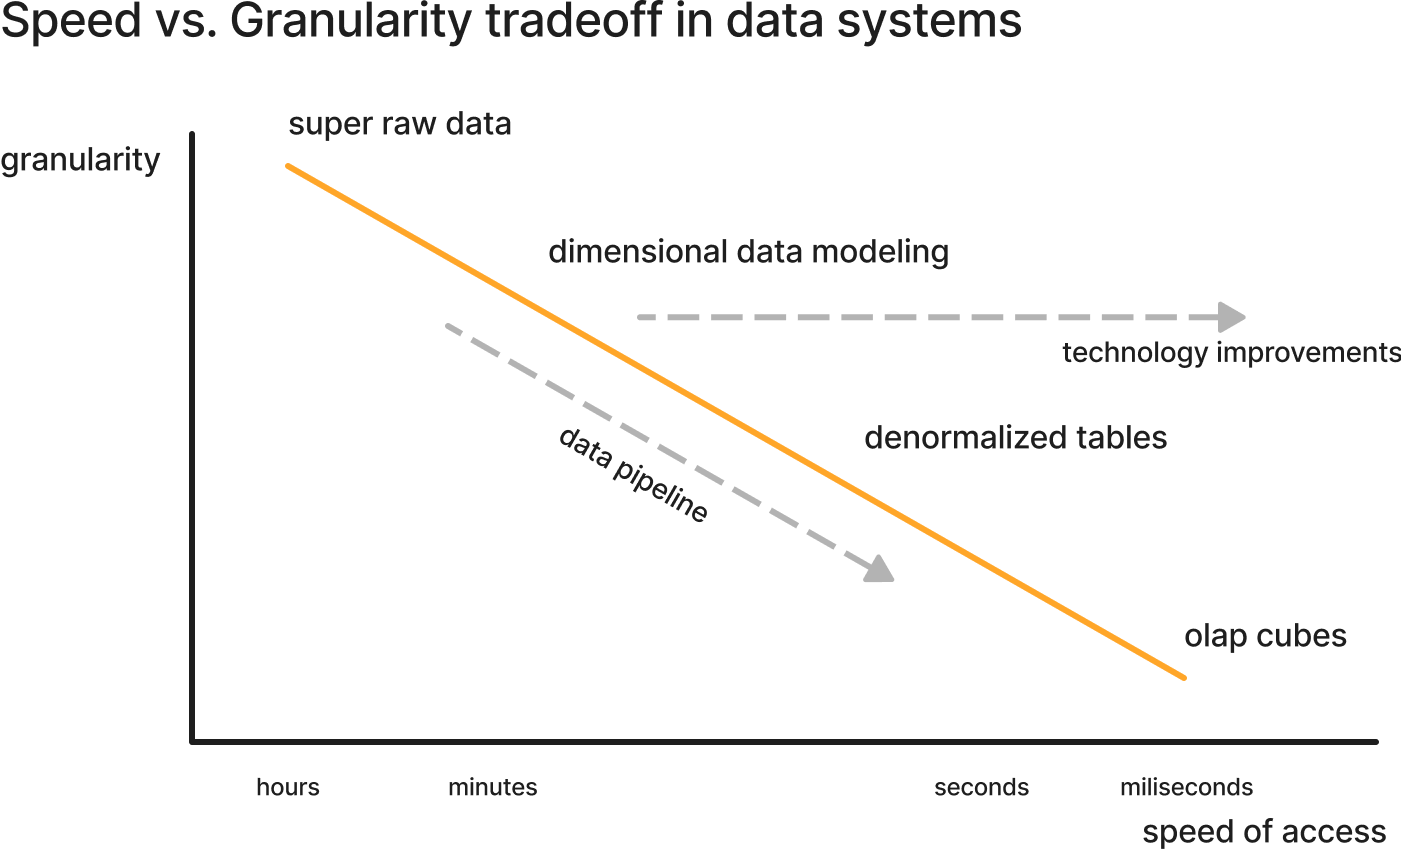
You can do additional processing on top of dimensional data modeling to increase speed of access. Optimizing for speed does require sacrificing granularity, but as technology continues to improve, these tradeoffs become less consequential. Denormalized tables and OLAP cubes are the two ways to increase speed of access. Building denormalized tables, or summary tables, on top of your dimensional data models enables faster performance, but it does require some sacrifice of granularity. For example, you can save the “last 7 day purchases” on a per-user basis in a single data table for fast access, but you’ll lose the ability to get “last 8 day purchases”. For many usage patterns, the speed is worth the tradeoff because users would rather see pre-baked data in 3 seconds than wait 30 seconds for customization.
OLAP cubes are a more intensive option to increase speed of access. An OLAP cube pre-aggregates the data so much that lookup queries are near-instant. However, they require much more prep, and they sacrifice more granularity. Denormalized tables are a better way to satisfy performance for most use cases.
It's also worth noting that newer technologies such as Druid and Pinot can have extremely fast querying using a single table. This makes denormalized tables an appealing option if you choose to use these technologies since you don't have to pre-aggregate. Check out this episode of The Data Stack Show to learn more about how Pinot was purpose built for speed.
In addition to this, there are also in-memory implementations of data models that allow for fast data access. Tableau has Tableau Data Extract – first with the tde format and more recently hyper formats to enable fast access of large datasets. Arrow is another in-memory approach that allows for data systems to be built with interactive performance.

This graph provides a rough representation of the speed vs. granularity tradeoff that’s central to dimensional data modeling. As speed increases, granularity decreases, and vise-versa. But what’s exciting to note is that as technology improves, the graph shifts further to the right. That is, we’re able to maintain more granularity at higher speeds. As each step gets faster, all of a sudden you can use the more granular technique for certain workloads and still meet user time expectations. This means a simpler data pipeline and less loss of granularity to achieve the same goals.
To drive the point home, consider the OLAP cube. OLAP cubes have largely fallen out of favor because recent advancements make denormalized tables a pretty good balance of performance and flexibility for most teams today.
Showing data history with slowly changing dimensions and snapshots
Sometimes it’s useful to see how data has changed over time. You may want to answer questions like:
- Have people moved in and out of audiences?
- Who are the people who were subscribers last year but are no longer subscribers today?
If you remember the dimension tables above, things change slowly, but they do change, and there’s often a great deal of value in understanding these changes. There are two techniques primarily used to show data history:
- Slowly Changing Dimensions – with this technique, you mark old rows as “stale” and add new rows. The most common technique is type-2 SCD, which works well for modern data pipelines.
- Snapshot – with this technique, you snapshot your data every day. It’s a good option in a world where data storage is cheap.
Depending on the questions you’re asking, the optimal technique for seeing your data history may change.
The benefits of immutability in fact tables
Fact tables are immutable logs, so they will never change. This immutability unlocks a few key benefits:
- You can add up behavior across each time period to get cumulative behavior
- You can tack on the latest behavior without having to recalculate everything
- You can trust that data won’t change under your feet
- You can quickly dive to any point in history
Immutability is why technologies like Grafana on InfluxDB (a time series database) are so fast. With immutability guarantees on monitoring, you can build systems that cache and pull data from billions of rows in milliseconds.
When immutability isn’t fully reliable
While immutability does come with its benefits, you can get into trouble if you try to take advantage of the benefits without safeguards.
A common situation is when event data is wrong or arrives late. The benefits of immutable data would suggest that you can process the latest data once without having to revisit the raw data. However, if your data within the processing window arrives too late, you run the risk of undercounting that information.
There are different ways to deal with these risks, and specific technologies have been created to address them. Apache Hudi, an incremental processing framework that came out of Uber, was initially based on the assumption that data can always be late, so the system must be able to neatly handle incremental changes. For our purposes today, it’s sufficient to flag that you must be thoughtful when considering immutability.
Dimensional data modeling is just the beginning
There are now companies working to build a better caching layer on top of dimensional data modeling that provides flexibility, performance, and self-service. Let’s look at a few examples.
Transform, MetriQL, and even dbt believe that a metrics layer is the best way for an organization to interface with increasing data volumes. Metrics are critically important for things like experimentation platforms which require users to select which metrics they expect to go up or down. You simply can’t do this with a dimensional data model alone, you need metrics too.
Looker abstracts data in the Looker Markup Language (LookML) to make it easier for users to access data without having to understand the underlying data models.
How does dimensional data modeling apply to RudderStack?
We’ve covered a lot about data modeling so far, and we’re only scratching the surface. It’s easy to see how entire careers are dedicated to data modeling and business intelligence. There really is a lot happening in the warehouse. Now we’ll shift gears a bit to explain how all of this applies to our three core customer data pipelines here at RudderStack: Event Streams, ETL, and Reverse ETL. Plus, we’ll introduce a forthcoming product, RS360, which is based on dimensional data models.
Event Streams
Track calls in RudderStack let you record customer events and the properties associated with them. When we write data to the warehouse, we write each event to its own track table as well as one large track table. These track tables emulate the immutability of fact tables and keep a running log of all user activity.
The Identify call lets you identify a visiting user, associate them to their actions, and record traits about them like their name and email address. Identify is a bit more complicated since it’s implemented via logs, but you can easily rebuild a dimension table for users by taking the most recent identify information and combining it with other data from your system.
Extracts
With ETL/ELT, you can unify and enrich your event data with data that lives in the SaaS systems your sales, support, and marketing teams use. Often these systems contain their own view of the user, which can be invaluable information in building out a 360 view of your customer.
Sometimes these systems create hybrids that are not obvious in the context of a user because they are not user-centric. For example, A Zendesk ticket is an object (dimension) because its properties can be updated, but creating or engaging with a ticket is an event (fact) that can be useful to aggregate at both the ticket level and user level. As a customer data platform, we primarily focus on data at the user level, but we also need to be very careful about how different objects interact with the customer data models.
Reverse ETL
Reverse ETL pipelines enable you to move processed data from your data warehouse into your business applications, effectively operationalizing the valuable analytics data. Reverse ETL use cases often benefit from a mix of static properties and aggregates of actual behavior. For example, in Salesforce you might want to send a mix of:
- Dimensions (company size, user, region, vertical)
- Aggregated facts (total visits, cumulative purchases, last 30 day purchases, feature usage)
- Derived data (ML model results, cohort membership)
Given the requirements above, the type of table you’d probably send via Reverse ETL is a denormalized table: one row, one user, and a bunch of properties. This transitions into how we’re thinking about our RudderStack 360 below.
RudderStack 360 (RS360)
RS360 will enable you to create a usable 360 table in your warehouse. This will give you a holistic view of all of the users, or entities, that exist within your RudderStack-connected data stack. Most of this data can be fed into RS360 from the other RudderStack-provided tools that we mentioned above (Event Streams and Extracts). RS360 will provide some really useful functionality out of the box:
- ID Stitching: This allows you to connect user activity through your first-party-app and other data from SaaS tools.
- Feature/ Traits table generation: This is the denormalized table that we mentioned above (i.e. one row per user with a bunch of features/traits as columns).
- Easy to configure: You have the ability within RudderStack to customize your id mapping tables and feature tables to meet your needs without writing complex sql.
- Current data: Because you’re already using the Identify Call you will have up-to-date data for your user’s most recent activities within your app. You can schedule how often and when this data syncs according to your requirements.
Additionally, all of this data will sit in your warehouse. This means that you have complete control over who has access to the data. Using the 360 table, you’ll be able to perform analytics, ML models, and audience targeting. You’ll also be able to send this data from your warehouse to other applications for activation. RS360 is currently in beta and will launch in Q1 2023.
A recap of dimensional data modeling
If you want to go deeper, one place to read more is Ralph Kimball’s book The Data Warehouse Toolkit. However, one of the most important things to remember is that organization is different, and these principles are best used as heuristics rather than strict guidelines.In under ten minutes, we’ve covered facts and dimensions–the building blocks of dimensional data modeling. We’ve worked through the speed vs. granularity tradeoff highlighting the denormalized table as today’s technique of choice. We touched on data history. We covered the benefits and the risks associated with immutability. Finally, we looked at a few of the innovations being built on top of dimensional data modeling and examined where it shows up at RudderStack.Even if you don’t spend all of your time in the warehouse, It’s helpful to understand the core concepts of dimensional data modeling because, as we detailed here with RudderStack, they show up in the wild more often than you might realize.
Try RudderStack today
Sign up for RudderStack to test out our event stream, ETL, and reverse-ETL pipelines today.

ABOUT THE AUTHOR
Brian Lu
Director of Product
Recent Posts

Subscribe
We'll send you updates from the blog and monthly release notes.

Get started today
Start building smarter customer data pipelines today with RudderStack. Our solutions engineering team is here to help.
This site uses cookies to improve your experience. If you want to learn more about cookies and why we use them, visit our cookie policy. We’ll assume you’re ok with this, but you can opt-out if you wish Cookie Settings.


